How Advertisers Allocate Holiday Ad Spend
October 3, 2019 by
We surveyed 243 SMB advertisers in July 2019 to understand when, how and where they are spending their holiday ad dollars. We conducted a similar study in 2018 as well, so we have the unique ability to compare 2019 ad spending trends to last year.
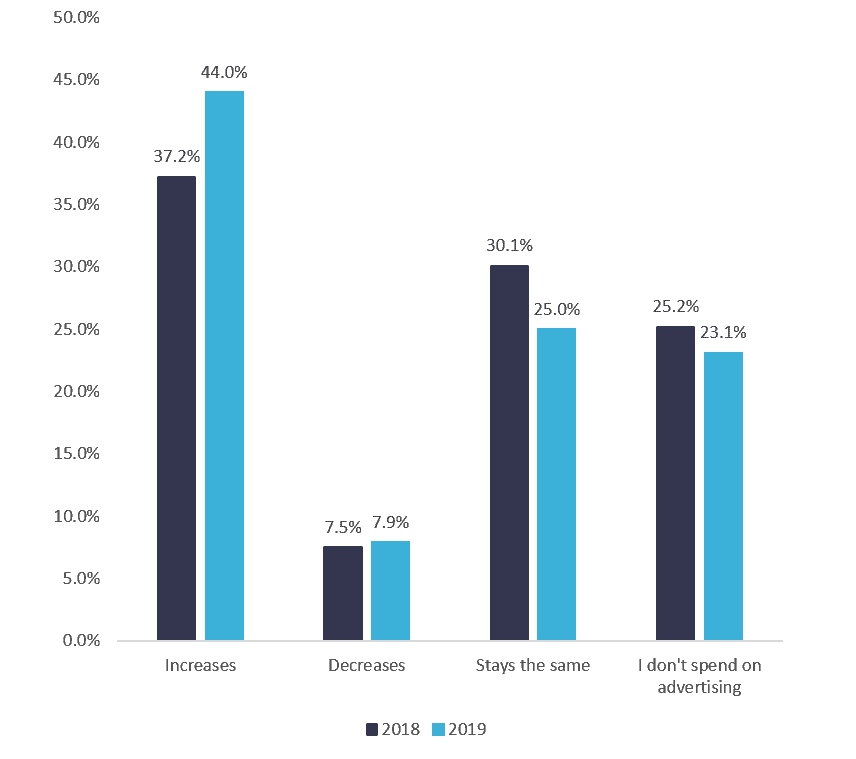
1. During the holidays, my advertising budget (or my clients’ ad budget):
Our research shows that 44% of SMB advertisers are increasing their ad spend for the holidays in 2019. This represents an 18.3% increase over last year. We have a few hypotheses as to why this is:
- When the economy is doing well, consumer confidence index goes up. SMBs tend to capitalize on that optimism by spending more on holiday advertising. With the CCI being fairly durable ad spending is up.
- The “retail apocalypse” seems to have slowed as well. The National Retail Foundation reports “for every retailer closing stores, five retailers are opening stores”. With more stores, there is more competition and the need to advertise.
- We also hypothesize that with the dominance of Amazon, Google, direct-to-consumer brands and big box stores, SMB businesses need to find a way to shine. They do this in the form of advertising and increasing their ad spend around the holidays. According to eMarketer, US retail spending is growing 3.7% over 2018 to just over one trillion dollars in 2019. SMBs want a piece of that.

2. When do you begin changing the messaging of your advertising for the holidays?
We like this question because it gives us a sense of timing, not only for change in messaging, but also for when holiday campaign planning takes place. Assuming a 60-90 day planning cycle, SMB advertisers predominantly begin preparing for their holiday season in the late summer months.

Notable in the year-over-year trends is that this planning and campaign adjustment is taking place later in the year. More SMB advertisers said this year they’re waiting later in the year to change their messaging. This becomes even more pronounced when grouping the results into the two Q3 months of data compared to Q4. So what’s going on here?

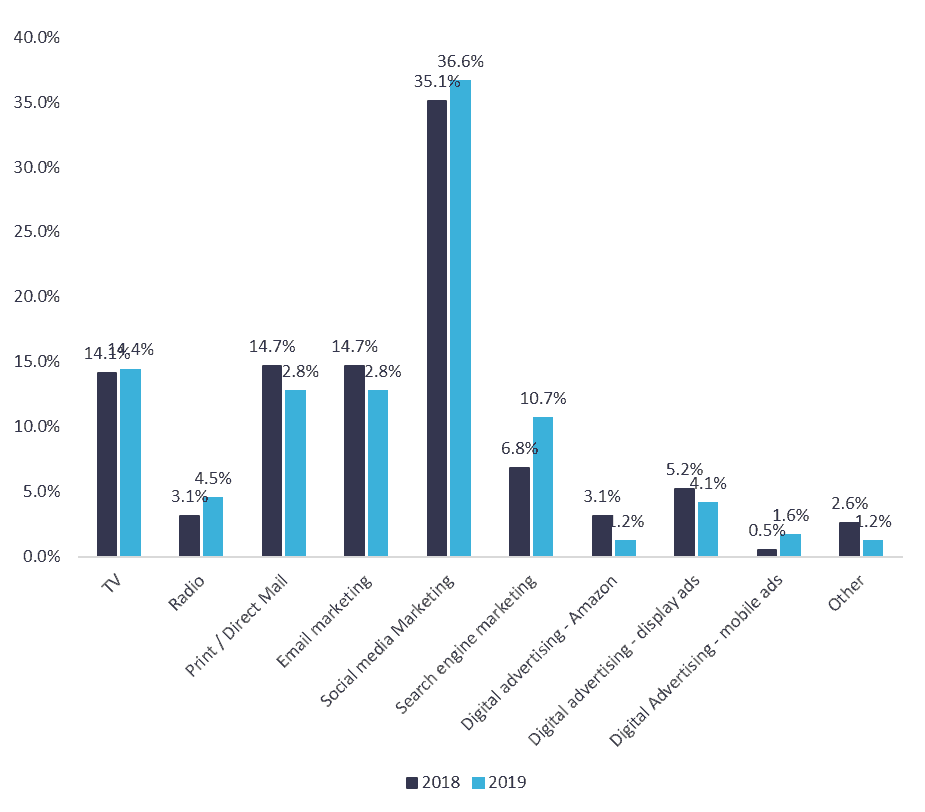
3. The majority of holiday advertising budget is allocated to:
When it comes to where SMB advertisers spend their holiday ad budget, there was not much of a change between 2018 and 2019. However, there are a few outliers.
One category that saw an increase this year is search engine marketing. This is noteworthy because it is one of the oldest forms of digital marketing. What’s old may be new again with improved tools for analytics and simplicity of starting and modifying SEM campaigns. It’s much easier today to run digital ads than it was even a few years ago, using the tools Google Ads makes available.
We also saw a small increase with radio advertising this year. Though traditional radio continues to be an effective form of advertising for the right advertisers and campaigns, streaming stations opened a new medium for advertisers. The Drum reports that “Spotify boasts nearly 200 million listeners every month, of which only half pay for its Premium ad-free tier. This makes the other 100 million listeners a viable target for targeted audio advertising”.

Something certainly worth calling out is that social media advertising dominates holiday ad spend. This has mostly to do with scale and the amount of time consumers spend on social  media platforms. Earlier this year, Digital Information World reported consumers spend “an average of 2 hours and 22 minutes per day on social networking and messaging platforms”. The platforms make it extremely easy for companies to spend money on their sites as well. With built-in targeting and reporting features, brands can easily advertise to their customers and automatically serve them ads. You can see an example of Facebook’s “Boost Post” button here in the callout.
While the social media platforms do make it incredibly easy to spend your money, this does result in a crowded field, and prices that continue to increase over time. Audience targeting refines campaigns and ensures less ad waste.
4. When I buy digital ads, I will primarily spend the digital advertising budget this holiday season on:
Drilling into social media a bit more, we can see that Facebook is the clear winner when it comes to capturing the SMB ad dollar at holiday time. When you combine Facebook and Instagram, they account for 60% of SMB ad spend in 2019.
It’s important to note that Facebook makes it seamless to advertise across Facebook and Instagram. When looking at just these four major digital advertising channels, Facebook and Instagram are where consumers are spending their time, and this is where the highest proportion of shoppers are looking to connect with products and brands they want to engage with. As we mentioned, Facebook also makes it very easy to build and deploy ads on their platform. And you can use additional data to build custom audiences for even greater targeting.

5. How important is geotargeting your campaigns this season?
First, a quick definition. Geotargeting generally includes advertising to people who live or work near specific places, visit specific locations, or are nearby certain locations at the moment an ad is served.
What jumps out here is the noticeable decrease in SMB advertisers stating this year they “use geotargeting for every campaign.” But there’s a more intriguing story hiding in this data.

When you look at the bigger picture, you can see that use of and perceptions around geotargeting are actually improving year over year. 88% of SMBs consider geotargeting to be important to their campaigns. To corroborate that stat, the latest annual survey of local U.S. advertisers by Borrell Associates shows that 79% of SMBs are using location data to target their ads.
The fewer advertisers who said “I use this for every campaign” in this year’s survey may have been early adopters of location intelligence for marketing. Location-based marketing and geotargeting are relatively new to targeted advertising, and expectations remain high.

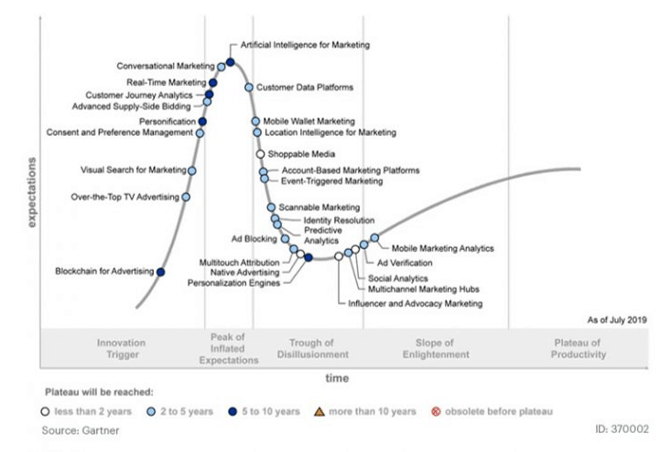
 Looking at geotargeting through the lens of the Gartner Hype Cycle, we see location intelligence for marketing moving from the peak of inflated expectations to the trough of disillusionment. This is likely a direct result of vendors and agencies over-promising and overstating its capabilities.
The result is that advertisers likely have not seen the mind-blowing results they were expecting right away. As a result, and correctly, they’re making sure they have a diversified portfolio of targeting options for their campaigns, customizing them to client requirements. The overall growth in emphasis on location-based marketing signals that we’re coming out of the trough of disillusionment and into the slope of enlightenment, which is a good place to be.
One final comment on how to look at location intelligence for marketing on this Hype Cycle. Anything to the left of the slope of enlightenment should be on your list of solutions to evaluate. These are things to shop for now so you can prove the value. Anything to the right of the slope of enlightenment should be in your marketing stack. These are the things that have already been proven and are on their way to commoditization, where they hit the plateau of productivity.
6. Where do you allocate your holiday ad spend during the holiday season?
As for the intended reach of spend, SMBs continue to spread their investments out evenly over the holidays, versus trying to focus only on Black Friday or Cyber Monday shoppers. SMBs typically don’t offer time-limited door-buster deals, choosing to win customers over the entire season instead of one-off promotions.
Note: For the large increase in people saying they spend consistently throughout the year, this is because we added this as an explicit option in the 2019 survey. In 2018, the response option was simply “Other,” and we wanted to get more specific on what we were capturing in this response set.

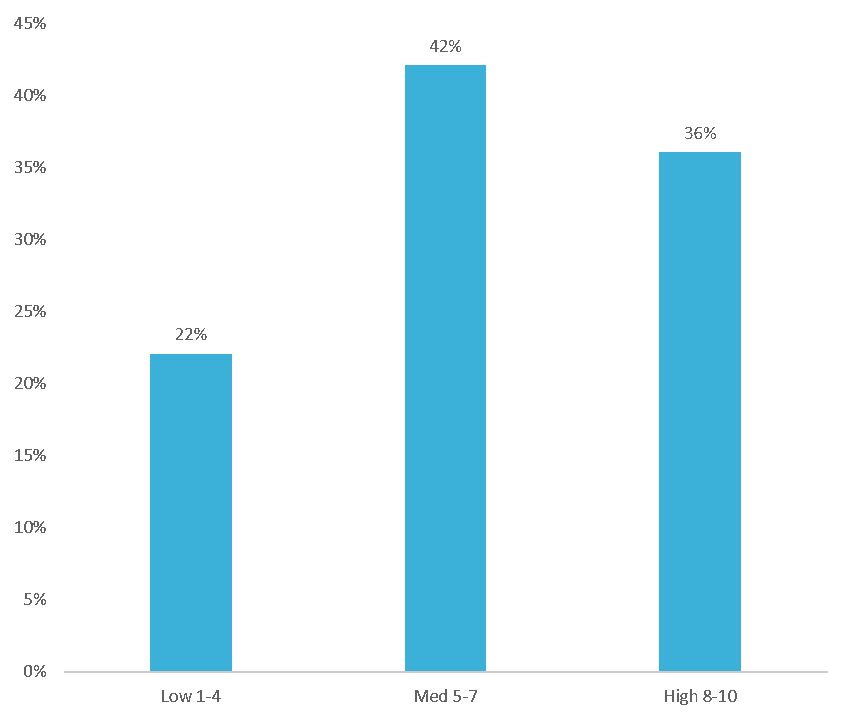
7. How confident are you in your ability to attribute your advertising campaigns to new sales?
(1 is least confident, 10 is most confident)
Perhaps the most sought-after metric and the most difficult to achieve is proving that advertising campaigns result in sales. To gauge the SMB community’s confidence on attribution, we asked this question, and were surprised by the results.
A significant percentage (36%) of SMB advertisers feel highly confident in their ability to attribute their campaigns to new sales. The majority, at 42%, also feel somewhat confident in demonstrating attribution.

To understand these results, it’s important to unpack what attribution is and how advertisers look to solve for it today. There’s a range of attribution from the simple to the complex, across both digital and traditional advertising. If you think about these methods on a continuum from easiest to hardest, it would be something like:

- Asking “How did you hear about us”?
- Coupons & Coupon codes
- Campaign specific phone numbers
- Pixel tracking
- Multi-touch attribution
- Location-based foot traffic attribution
- Point-of-sale integration
Digital vs. Traditional
When we look at attribution in the context of respondents who spend on digital vs. those who spend on traditional advertising, new insights emerge. While 70% of SMBs feel at least somewhat confident in being able to attribute their traditional ad spend to sales, almost 85% feel that way when advertising via digital channels.
We expect advertisers to feel more confident in demonstrating attribution via digital, assuming a portion of their sales also occur online. While assigning influence to various channels and campaigns is difficult, showing an online ad converted to an online sale does provide a 1-to-1 connection. However, showing that digital ads resulted in in-store sales is a complex challenge to solve, as the data tends to be siloed in ad details, foot traffic, and purchase transaction data. Location data is mortar that sits between these bricks.

To find out more about location-based analytics, audiences and attribution, contact us.

