
How to Use Geofencing in a Social Media Campaign
September 10, 2021 by
Step 1: Analyze Foot Traffic
Step 2: Build Your Audience
Step 3: Measure Campaign Effectiveness
Step 1: Analyze Foot Traffic
The first step in the most successful paid social campaigns is learning everything you can about your customers. You may know general demographics like income range, age, and other lifestyle factors that explain why your customers have an affinity for your brand. You probably also think you know who your biggest competitors are. But did you know that with geofencing you can see what competitors your customers actually visit and exactly who your competitors are?
In the example here, we’re taking a look at the high-end burger chain BurgerFi. With geofencing software, we can see that BurgerFi’s biggest competitors are Subway and Hagen Dazs. BurgerFi can consider those two chains to be the one siphoning off the largest share of their customers’ QSR dollars.
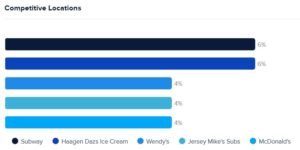
Source: VISIT Local
With the same geofencing software, we can also see other places BurgerFi’s customers go. As it turns out, the store with the most cross-over is Crocs. We could deduce that BurgerFi’s has a huge Gen Z customer base since Gen Z’s wear Crocs are popular with the demographic. It’s also likely that families who have young children eat at BurgerFi and have purchased Crocs for their kids.
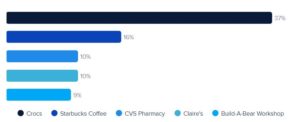
Source: VISIT Local
Step 2: Build Your Audiences
When building a custom audience, the first thing that comes to mind tends to be retargeting. This is easy to do and a great way to increase customer loyalty and retention.
The next segment of a custom audience is usually your competitors’ customers. You want to win market share and convince their customers that your offering is better.
These first two segments come as easy buttons in VISIT Local. You can pull these audiences right out of the platform and run paid social ads targeting just these people who are most likely to convert.
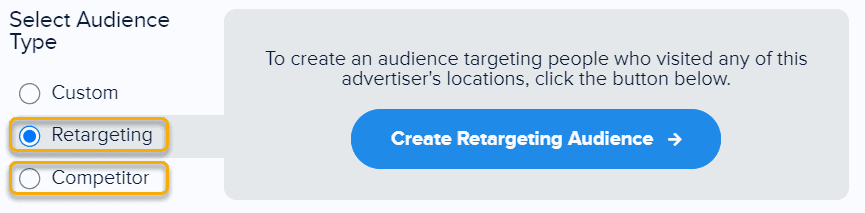
Source: VISIT Local
The third, and arguably the most important segment to a custom audience is finding and reaching those people who are most likely to convert. They may be new to your brand or haven’t visited in a long time. In our BurgerFi example, the chain could target those who visit Crocs stores, Starbucks, and CVS, which are the other locations BurgerFi’s customers also shop.
Since we are assuming that a large portion of BurgerFi’s customers are Gen Z, they can target other places Gen Z kids go, such as college bars near BurgerFi locations, coffee shops, gyms, and other locations Gen Z frequents.
This brings us to the intermediary step between two and three — where are you going to serve media to these custom audiences. Social channels are a great place to start. To find out more about how to use custom audiences on social media, download the free guide.
Tik Tok is a great place to reach Gen Zs who are most likely to convert. New to Tik Tok advertising? Check out this video, where we dive into how to get the most out of this channel.
Step 3: Measure Campaign Effectiveness Daily with Foot Traffic Attribution
Finally, how do you measure campaign success? You have to use foot traffic attribution in order to go beyond creative- and messaging-focused metrics like clicks, likes and shares. With geofencing software, you are able to see how many in-store conversions there were out of the audience you targeted — who actually showed up to shop and buy products.
Some campaigns are designed to drive awareness, followers, likes, clicks and other metrics to boost brand lift, but when you want to see which campaigns are actually driving business metrics such as store visits and sales, you need to measure foot traffic attribution. This is easy with geofencing software.
In our hypothetical BurgerFi example, you can see the restaurant had 324 unique conversions. This means 324 people who were in the custom audience BurgerFi targeted actually showed up in-store to buy a burger. Multiply 324 by the average value of a visit, and BurgerFi has their top-line business results. Return on ad spend comes with dividing that top-line number by ad spend. These are the results top marketing management wants.
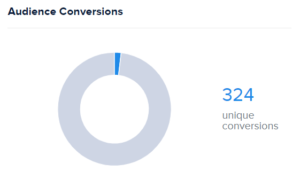
Source: VISIT Local
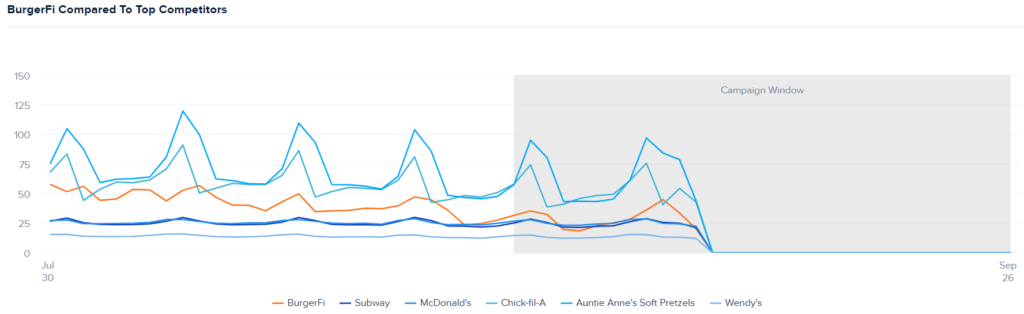
Additionally, marketers can see how their store’s foot traffic stands up against the competition’s before and during the campaign window in this chart. By tracking daily conversions, BurgerFi could make adjustments to their social campaigns mid-flight to maximize ad spend.
This was just one simple example of how you can use parts of the reporting and capabilities of VISIT Local to drive foot traffic and measure campaign performance. For more examples or to get a demo of how this would work for you or your clients, reach out to us today. Your competition probably already has.
