Measuring Holiday Foot Traffic Trends: The Future Of Retail Marketing
March 29, 2022 by
Portions of this article originally appeared on Forbes.com.
New technologies in the mobile phone era are enabling the measurement of retail foot traffic that will ultimately change how retail promotions are evaluated and how retailers compete.
Data sourced from opted-in location-sharing mobile devices will likely become a major metric for brick-and-mortar campaign success — just as the number of unique monthly visitors is to e-commerce sites. Both sets of data (real world and digital) can be mined for determining what’s working and what isn’t as retailers compare their data to the competition.
The most recent holiday shopping season is a great example. Anonymized, historical location data from devices can show which retailers won the battle for foot traffic both for the all-important Black Friday shopping day and throughout the holiday season.
The holiday season is the retail industry’s make-or-break opportunity for a profitable year. This year was no different, and the news was mostly positive.
The National Retail Federation reported that more than 174 million Americans shopped over Thanksgiving weekend (from Thanksgiving Day to Cyber Monday) — 51 million were in-store only, 64 million purchased both in-store and online, and 58 million were exclusively online shoppers.
The surge of people researching, evaluating and ultimately buying online or via mobile apps during the holiday season continued. Adobe Insights (via CNBC.com) reported that mobile devices accounted for 46.2% of digital revenue on Black Friday, an increase of 18.4% over 2016.
Despite these trends and headlines such as “Mobile wins Black Friday shopping,” the good news for brick-and-mortar retailers is that most Black Friday shopping is still taking place at physical store locations, with 77 million making a trip to purchase items vs. 66 million buying online, according to Adobe (via Multichannel Merchant).
Reveal Mobile’s Black Friday Foot Traffic Data
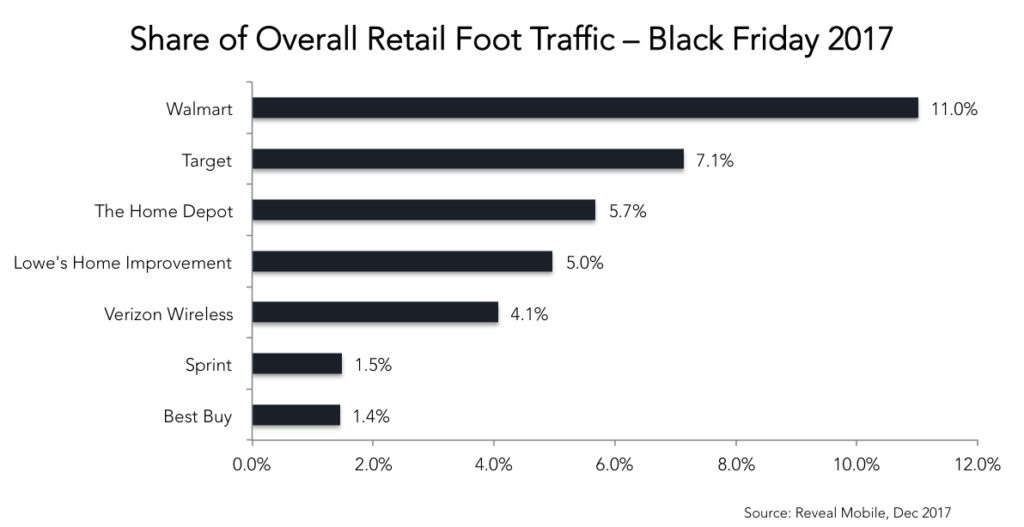
Foot traffic trends that we at Reveal Mobile compiled from mobile location data at over 8 million U.S. locations found that these seven retail chains saw the most visits on Black Friday: Walmart, Target, The Home Depot, Lowe’s Home Improvement, Verizon Wireless, Sprint and Best Buy, commanding 35.8% of all retail foot traffic on Black Friday.
As shown in the figure above, Walmart captured 11% of all Black Friday retail visits, followed by Target with 7.1%. This can be critical information for any retailer wanting to see how they compared in foot traffic with these top retailers and determine what worked and what didn’t with consumers.
While Walmart and Target command the top spots for retail foot traffic on Black Friday, one observation that surprised us is the substantial in-store traffic that the two big home improvement stores, Lowes and Home Depot, saw on that day. They also ran aggressive promotions on high priced, in-demand products, just as much as the electronic stores and big box retailers, and consumers responded.

When we look at the top seven locations as a group, they initially garnered over 20% of all retail foot traffic that we measured, waning to 13.5% as the day progressed.

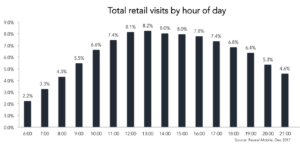
What’s interesting here is that the shopping trends at the top seven skew heavily towards the Black Friday early morning shoppers, where they see large audiences showing up for the store opening. This is in contrast to the overall trend in retail visits for the day, which peaked during the lunch and afternoon hours, not the morning hours.
The bulk of shopping takes place during the lunch and afternoon hours:
Morning: 6am – 11am, 21.9%
Lunch: 11am – 2pm, 31.9%
Afternoon: 2pm – 6pm, 29.9%
Evening: 6pm – Closing, 16.3%
Starting at the top, we see that only a small portion of the shopping public ventures out during the wee hours of the morning, with just 2.2% of all shopping traffic on Black Friday occurring at 6am in the morning.
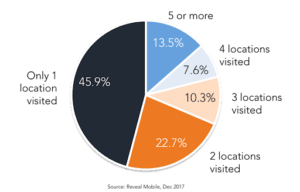
The final data to share is the amount of locations that retail shoppers visited on Black Friday. Most only preferred to visit a single location (45.9%), but a sizable percentage (13.5%) did visit five or more locations.
The data used in this study is sourced from opted-in location sharing mobile devices. It contains no personally identifiable information, and is aggregated into anonymized audience segments such as “Walmart shoppers” and “Home Depot shoppers”. Reveal Mobile’s privacy compliant approach has earned the company membership in the Network Advertising Initiative, the leading self-regulatory association dedicated to responsible data collection and its use in digital advertising.
Holiday Season Retail Foot Traffic
When looking across the entire holiday shopping season and the most visited locations, Walmart captured the majority of retail foot traffic, ranging from 30% to 38% per day against the other six major retailers. Again, this is likely due to the fact that Walmart has twice as many stores as its peers. From this data, it’s easy to see that Walmart is the Goliath in retail foot traffic that other retailers will need to compete better against during the 2018 holiday season.
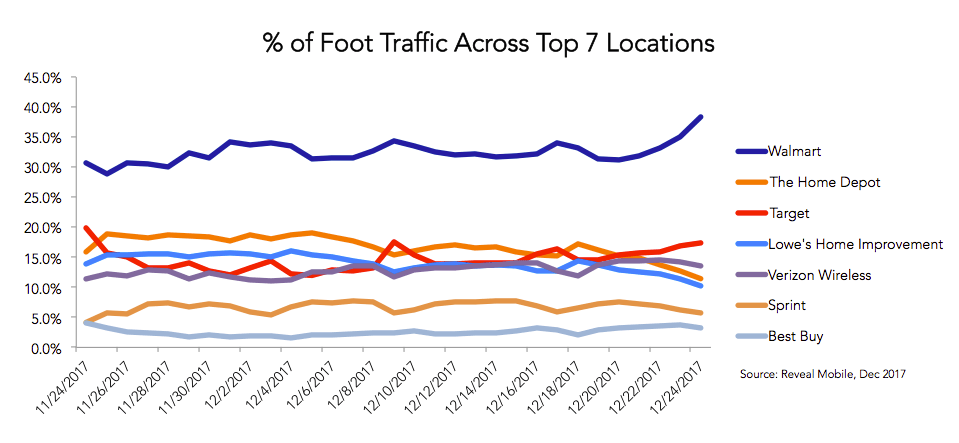
One interesting observation (figure 2) was the late holiday surge in shoppers visiting both Walmart and Target on December 23 and 24. For the top seven visited locations, Walmart took 30-38% of each day’s foot traffic when measured against the other six retail chains. We believe that this trend is not driven entirely by gift shopping but rather by the ability to also purchase food and pantry items in preparation for friends and family visits, with holiday presents as a secondary motivator. These are the sorts of insights that can be derived from real-world visitor data.
Foot Traffic Data Best Practices
If you’re a business looking to leverage foot traffic data and turn it into relevant insights, here are a few best practices to follow:
- Look beyond your own location data sets: While most major retailers have their own mobile apps, and therefore the ability to build location-based analytics from that audience, that typically doesn’t provide a sizable enough audience to create a statistically significant panel. Partnering with other firms and data providers allows retailers to amplify their audience size and increase their confidence in the results.
- Location-based audiences provide value before, during and after ad campaigns: Before a campaign begins, location-based audiences help define the most relevant audience to reach. Relevancy can be a retailer’s own audience, a competitor’s audience or visitors to related industries.
- If possible, combine standard campaign data with purchase data: By marrying together standard campaign data with purchase data, like impressions and clicks with footfall data, marketers begin to see the true efficacy of the advertising spend. This will enable them to make more intelligent campaign budget decisions moving forward.
The role that mobile and digital purchasing will play over future holiday seasons points to increasing influence, whether from sales directly online, by helping to inform in-store purchases or by allowing retailers to measure increases in foot traffic and sales and therefore measure the efficacy of their campaigns.
We expect to see continued innovation from retailers of all sizes to combine all the marketing and analytics tools in their belt to compete for consumer spend. Measuring the impact of those efforts in driving new foot traffic, and ultimately sales, will be critical for them to determine where to invest their marketing spend in the future.

